
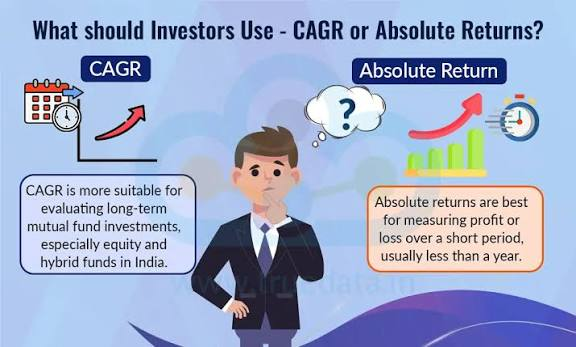
An investment valued at ₹10,000 today might be worth ₹12,100 two years later. The total change is easy to calculate, but it does not tell you how to describe that change as a yearly rate. CAGR helps with that.
CAGR stands for compound annual growth rate. It expresses the change from a starting value to an ending value as one annualised rate. A CAGR calculator can work it out quickly, provided you know the two values and the length of time between them.
What does CAGR measure?
Think of CAGR as a way to summarise a journey using its starting point, ending point and duration. It answers: what constant annual rate would connect those values if the change had compounded evenly? It does not say that the investment actually changed by that amount every year.
Suppose the ₹10,000 investment becomes ₹12,100 after two years, with no money added or withdrawn. The CAGR is 10%: at a constant 10% annual rate, ₹10,000 would become ₹11,000 after year one and ₹12,100 after year two. The real values during those years could have followed a very different path.
The figures shown are for illustrative purpose only
How do you calculate CAGR?
The formula is: (ending value / starting value) raised to the power of (1 / number of years), minus 1. Multiply the result by 100 to express it as a percentage. You can enter those three inputs into a CAGR calculator instead of working through the formula by hand.
Use values from the same investment and exact period. If you measure from 1 January to 31 December, for example, do not pair a starting value from January with an ending value taken weeks after December. If you use a period that is not a whole number of years, check how the calculator handles partial years.
The starting value must be greater than zero for this common investment formula to make sense. Also check whether your ending value includes any distributions you received. Ignoring money paid out along the way can make the calculated rate describe only the change in the remaining value.
The calculator is an aid, not a prediction tool. It may provide only an indicative picture.
Why is CAGR useful?
CAGR gives you a common yearly scale for periods of different lengths. It may help you understand a past result or compare two historical periods, as long as the figures are prepared on a comparable basis. A 10% two-year CAGR and a 10% five-year CAGR are both annualised rates, but they describe different stretches of time and potentially different experiences.
It can also make the difference between total change and annualised change clearer. A 21% increase over two years in our example becomes a 10% CAGR, not 10.5% per year. Dividing the total percentage change by two misses the effect of compounding.
A mutual fund returns calculator may display an annualised figure for a selected period. Before comparing that number with your own CAGR, check what each calculation includes, such as distributions and the dates used. Different inputs can produce different figures even when they concern the same fund.
When can CAGR mislead?
CAGR smooths the path between the first and last values. A fund could rise sharply, fall, and recover before the end date, yet its CAGR would show only one annualised rate. It tells you little about the size or timing of those changes.
It is also less suitable when you add money or withdraw it during the period. The basic formula cannot distinguish potential growth in value from cash you contributed later. If you have several dated cash flows, a calculation that uses each amount and date may be more suitable for understanding your personal experience.
A mutual fund returns calculator may use its own method for recurring investments. Read the labels and inputs before treating its output as comparable with a CAGR calculator result for a single lump sum.
Use the result with context
CAGR is a description of a selected past period. It is not a potential future rate you can count on. The end date matters too: moving it can change the figure, especially when values have moved considerably near that date.
When you review an investment, keep the starting amount, ending amount and period beside the annualised number. If there were additional contributions, withdrawals or distributions, make sure the calculation accounts for them. That context can tell you whether CAGR is answering the question you meant to ask.
A CAGR calculator is useful for seeing what a change between two values looks like on a yearly scale. Use it to understand the arithmetic, then consider the path and cash flows that its single percentage leaves out.
Mutual Fund investments are subject to market risks, read all scheme related documents carefully.
